[1]:
%matplotlib inline
A tutorial
This is a Jupyter notebook.
[2]:
import numpy as np
import matplotlib.pyplot as plt
Plotting
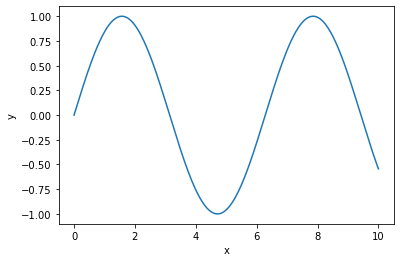
It has a plot:
[3]:
x = np.linspace(0, 10, 5000)
plt.plot(x, np.sin(x))
plt.xlabel("x")
plt.ylabel("y");
[3]:
Text(0, 0.5, 'y')
[ ]: